
More visitors won’t necessarily mean more sales. An ecommerce conversion rate is the percentage of website visitors who complete a purchase, calculated by dividing purchases by visitors and multiplying by 100. Improving website conversion rates starts with measuring that figure consistently, not simply counting traffic.
It’s easy to assume there’s one ideal rate to aim for, but a useful comparison depends on factors such as your industry, audience and the types of devices your visitors use. This article explains what the measure tells you, how ecommerce benchmarks can inform your expectations, and how to calculate your own rate with a simple example. You’ll have a clearer way to assess performance and decide what to improve next.
Key Takeaways
- Set a clear call to action so visitors know what to do next, and make the purchase journey work smoothly on mobile.
- Use industry and device benchmarks as context, not as a universal target for every online shop.
- Calculate your rate by dividing completed purchases by website visitors, then multiplying by 100.
- Track the same type of conversion consistently to see where your store may need improvement.
1. What is an ecommerce conversion rate?
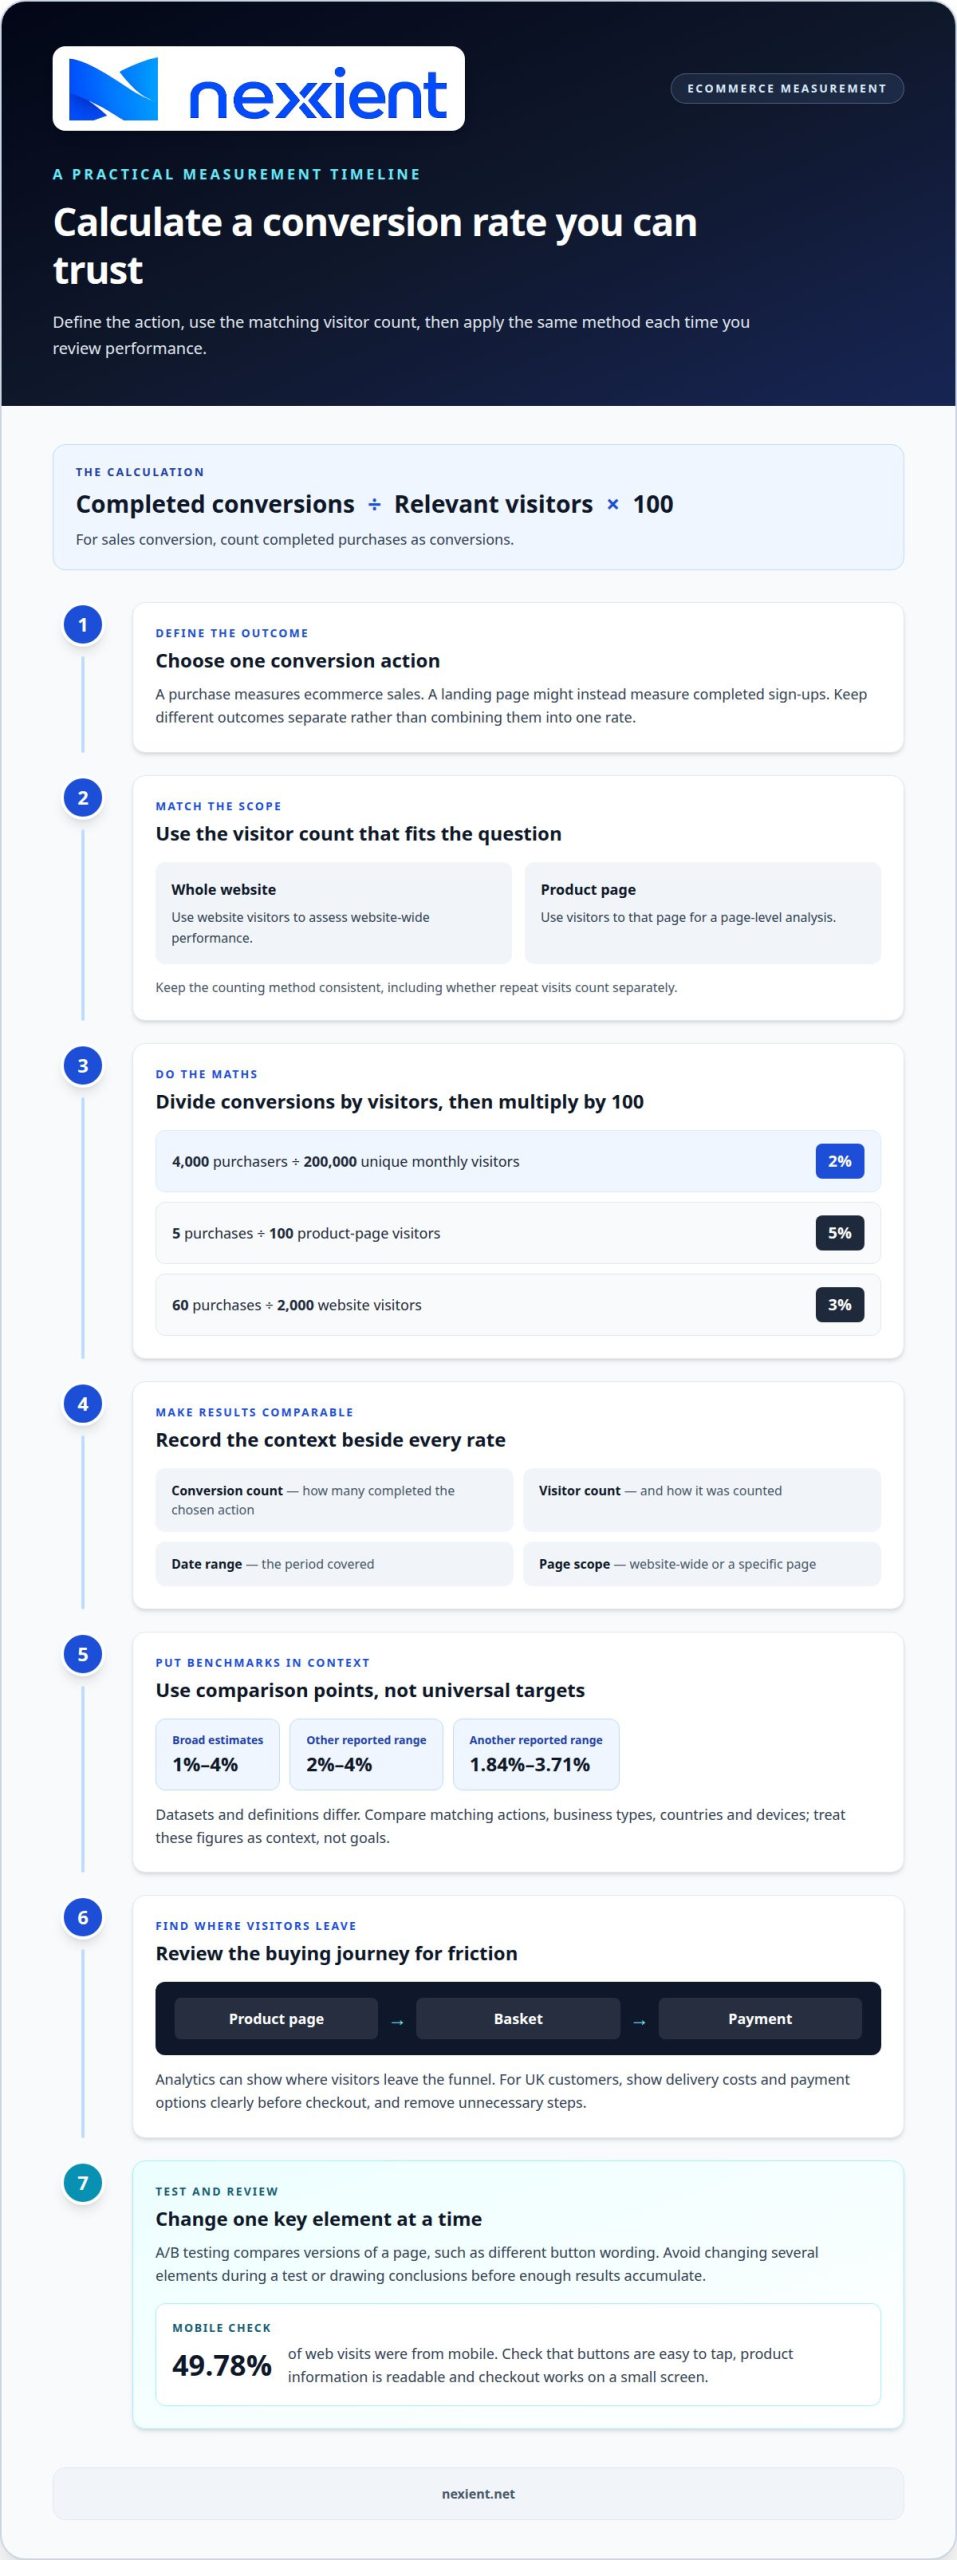
An ecommerce conversion rate is the percentage of visitors who complete a chosen action, usually buying. Divide completed purchases by visitors, then multiply by 100. For example, 4,000 purchasers from 200,000 unique monthly visitors equals 2% a month. Define the target action before comparing results.
Make the next step clear with a prominent call to action, such as “Add to basket”. Place it near the product details and repeat it where visitors need to act. Use concise copy that addresses a customer problem. A subtle supporting prompt can help, but avoid competing buttons or false urgency.
Mobile optimisation matters: mobile traffic accounted for 49.78% of web visits. Check that buttons are easy to tap, product information is readable and checkout works on a small screen. Keep marketing messages and calls to action consistent across mobile and desktop versions.
For UK websites, explain cookie use and privacy clearly, and seek consent where required for non-essential cookies. Conversion rate optimisation costs depend on project scope, website complexity and testing needs. Set out the work required before agreeing a budget.
A/B testing compares versions of a page, such as different button wording, to see which better supports the target action. Change one key element at a time. Analytics can show where visitors leave a funnel, from product page to basket to payment, helping you locate friction.
For UK customers, show delivery costs and payment options clearly before checkout, and remove unnecessary steps. Common mistakes include unclear calls to action, changing several elements during a test and drawing conclusions before enough results accumulate. Use genuine deadlines only.
2. Conversion rate benchmarks
Ecommerce benchmarks vary by dataset and definition. Broad estimates put average rates between 1% and 4%; other figures range from 2% to 4%, or 1.84% to 3.71%. Treat these as comparison points, not targets. A purchase, lead and account registration are different conversion actions, so compare matching metrics.
For UK context, one 2022 survey reported an ecommerce conversion rate of 4.1%. Its cited US figure was 2.3% in 2022. These figures reflect different markets and survey methods, so they don’t show what every UK shop should achieve. They also shouldn’t be treated as immediate performance goals.
Industry makes a difference too. The reported arts and crafts range was 3.84% to 4.07% in the last quarter of 2022. Health and wellbeing ranged from 1.87% to 4.20% over that period. A separate set of industry averages gives arts and crafts 3.79%, baby and child 3.99%, and pet care 3.28%.
Other reported averages include 2.37% for food and drink, 2.44% for fashion, and 1.55% for cars and motorcycling. Differences between datasets can arise from their timeframes, visitor groups and conversion definitions. Compare like with like before drawing conclusions.
For a useful benchmark, match your business type, country, device and chosen action. Then review your own metrics over consistent periods and use testing to investigate gaps. Google search traffic and paid marketing may attract different audiences, so assess their results separately. Good optimisation should improve the user experience, not just raise a percentage.
If the comparison points to a focused page redesign, discuss your conversion goals.
3. Calculating ecommerce conversion rates
Use one consistent formula: divide completed conversions by the relevant visitor count, then multiply by 100. For sales conversion, count purchases as conversions. A product page with 100 visitors and 5 purchases has a 5% conversion rate. An online store with 2,000 visitors and 60 completed purchases has a 3% sales conversion rate.
Choose the visitor count that matches the question you’re asking. Website-wide performance uses website visitors; a product-page analysis uses visitors to that page. Keep the measurement method consistent across periods, and define whether repeat visits count separately. Otherwise, changes in traffic measurement can make the rate appear to shift even when buying behaviour hasn’t.
Next, define the conversion that matters. A purchase is useful for measuring ecommerce sales, while a landing page might count completed sign-ups. Don’t combine those outcomes in one rate. For a clearer view, calculate each key action separately, then compare results across pages, traffic sources or devices.
Use the calculation to guide action, not just reporting. If a landing page attracts traffic but few sign-ups, review whether its message matches visitors’ needs and whether the next step is clear. Social proof, such as customer reviews, can encourage engagement, but measure completed purchases separately to see how it relates to sales.
Record the number of conversions, visitor count, date range and page scope beside every result. This makes comparisons useful and helps identify where further testing may be worthwhile. To connect measurement with a clearer online buying journey, discuss your ecommerce website goals.
Nexient: Website Maintenance
Nexient provides Website Maintenance to help businesses keep their websites aligned with their goals. If your conversion figures show that a page needs attention, maintenance can help address ongoing website needs and keep planned improvements on track.
For an online shop, review how product pages and checkout support the purchase journey. For a campaign, check whether the landing page reflects its message and intended action. Nexient also creates eCommerce Websites, Business Websites and Landing Pages, offering options when maintenance alone isn’t the right fit.
Share what you’ve measured and where visitors appear to drop off, then discuss practical next steps with Nexient.
Turn insight into your next step
Turn your conversion data into a practical roadmap. Choose the customer journey that matters most, then prioritise changes by the obstacles they remove for customers and the value they could create. A disciplined approach to improving website conversion rates keeps design decisions connected to business goals, with each measured change informing what to do next.
Set a review rhythm that reflects how often your offer, audience or website changes. Record what you adjust and learn, so future decisions build on evidence rather than assumptions. Nexient offers Business Websites, eCommerce Websites and Landing Pages to shape online experiences around your business needs and the actions you want visitors to take.
Bring your priorities and questions into the conversation to make the next steps practical and focused. Contact Nexient to discuss your needs, and move forward with confidence.
Frequently Asked Questions
What is an ecommerce conversion rate?
An ecommerce conversion rate measures how often website visitors complete a chosen action, usually a purchase. Decide whether your reporting counts visitors or visits, then use that basis consistently, as the two can produce different results. If you also track newsletter sign-ups, report them separately from purchases to keep sales performance clear.
How can you improve conversion rates on a website?
Start by identifying a page or step where visitors hesitate, then make one focused change. For example, clarify product details or make delivery information easier to find before checkout. A structured approach to improving website conversion rates pairs each change with a clear goal, then checks whether the intended action becomes easier to complete.
How does user experience affect conversion rates?
A confusing or awkward experience can make visitors work harder to find information or complete a purchase. Keep product descriptions easy to scan, navigation labels familiar and checkout steps straightforward. Test the journey on a mobile device as well as a computer, paying particular attention to forms, buttons and instructions visitors need to complete the process.
What does it mean to increase conversion rates?
It means a larger share of visitors completes the action you have defined, such as buying a product or submitting an enquiry. The right measure depends on the page’s purpose. For example, a campaign page may focus on enquiries, while an online shop tracks completed purchases. More conversions do not automatically mean higher revenue, so consider the quality and value of each action too.
What is a good website conversion rate benchmark for UK businesses by industry?
There isn’t one benchmark that suits every UK business. Industry averages vary: reported figures include 3.99% for baby and child, 3.62% for health and wellbeing, and 1.75% for sports and recreation. Treat these as context rather than targets. Compare rates using the same conversion definition, time period and visitor group before deciding whether your performance needs attention.